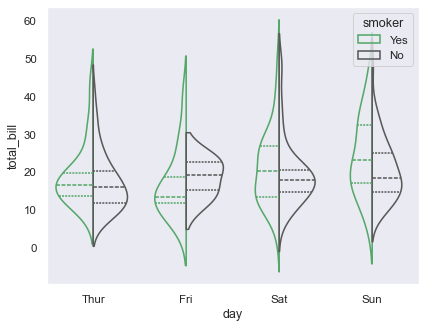
分組後提琴圖,其中提琴圖是分開的 #
所用的 seaborn 元件: set_theme()、load_dataset()、violinplot()
import seaborn as sns
sns.set_theme(style="dark")

# Load the example tips dataset
tips = sns.load_dataset("tips")

# Draw a nested violinplot and split the violins for easier comparison
sns.violinplot(data=tips, x="day", y="total_bill", hue="smoker",
               split=True, inner="quart", fill=False,
               palette={"Yes": "g", "No": ".35"})