邊際刻度的散點圖#
使用的 seaborn 元件: set_theme(), load_dataset(), JointGrid
import seaborn as sns
sns.set_theme(style="white", color_codes=True)
mpg = sns.load_dataset("mpg")
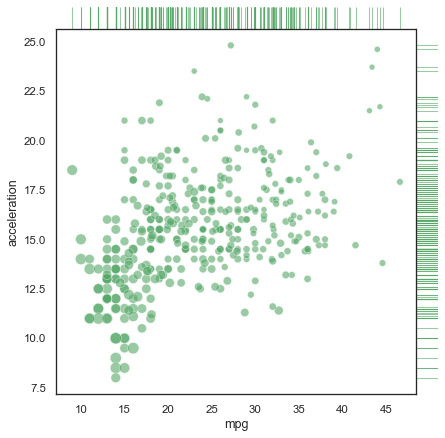
# Use JointGrid directly to draw a custom plot
g = sns.JointGrid(data=mpg, x="mpg", y="acceleration", space=0, ratio=17)
g.plot_joint(sns.scatterplot, size=mpg["horsepower"], sizes=(30, 120),
color="g", alpha=.6, legend=False)
g.plot_marginals(sns.rugplot, height=1, color="g", alpha=.6)