邊際分布線性迴歸#
使用的 seaborn 元件: set_theme(), load_dataset(), jointplot()
import seaborn as sns
sns.set_theme(style="darkgrid")
tips = sns.load_dataset("tips")
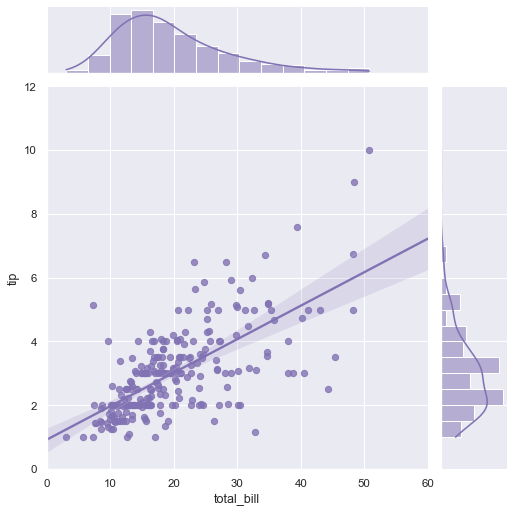
g = sns.jointplot(x="total_bill", y="tip", data=tips,
kind="reg", truncate=False,
xlim=(0, 60), ylim=(0, 12),
color="m", height=7)