具有兩個類別變數的三元圖直方圖#
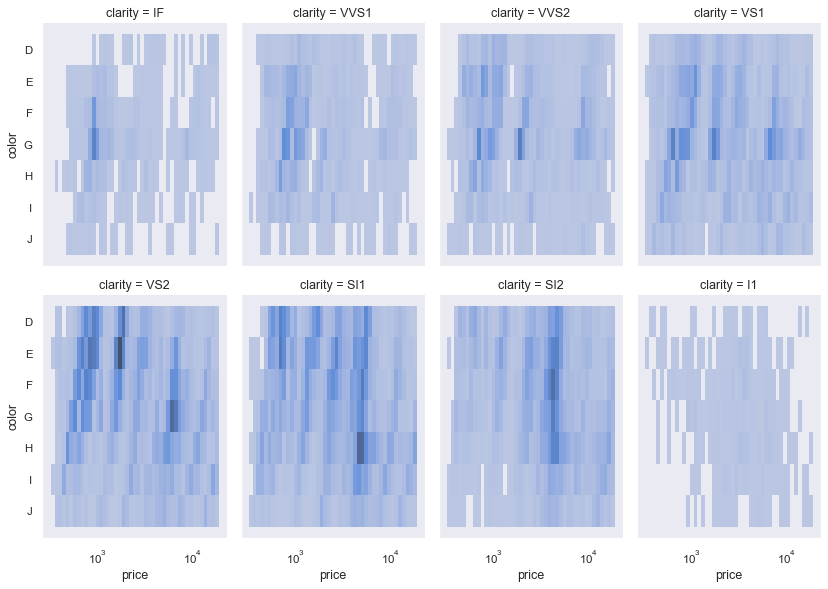
使用的 seaborn 元件: set_theme(),load_dataset(),displot()
import seaborn as sns
sns.set_theme(style="dark")

diamonds = sns.load_dataset("diamonds")
sns.displot(
    data=diamonds, x="price", y="color", col="clarity",
    log_scale=(True, False), col_wrap=4, height=4, aspect=.7,
)