控制圖形美學#
描繪吸睛的圖形非常重要。在你探索資料集時,為自己製作圖形,漂亮的繪圖看了心曠神怡。視覺化在與觀眾溝通定量見解時是核心,在這種情況下,擁有能吸引注意力並引觀眾入勝的圖形,更顯必要。
Matplotlib 有高度自訂性,但可能難以弄清楚要微調哪些設定才能製作出吸睛的繪圖。Seaborn 提供多種自訂佈景主題,以及用於控制 matplotlib 圖形樣貌的高階介面。
import numpy as np
import seaborn as sns
import matplotlib.pyplot as plt
來定義一個簡單的函數,以繪製一些偏移正弦波,這將有助於我們了解能調整的不同樣式參數。
def sinplot(n=10, flip=1):
    x = np.linspace(0, 14, 100)
    for i in range(1, n + 1):
        plt.plot(x, np.sin(x + i * .5) * (n + 2 - i) * flip)
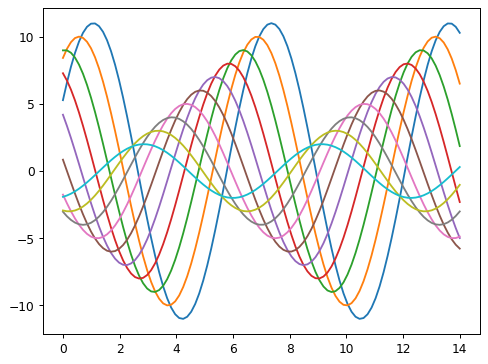
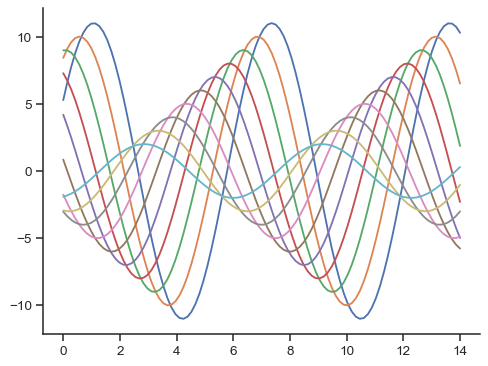
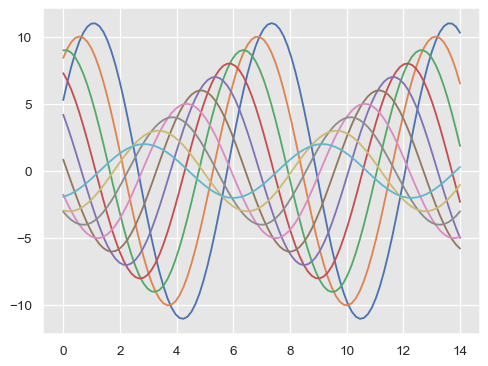
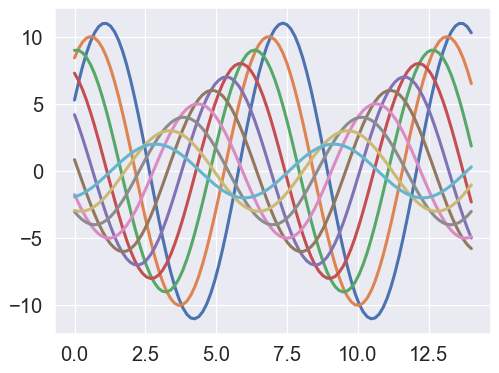
這是使用 matplotlib 預設值繪製的圖形
sinplot()
如需切換至 seaborn 預設值,只需呼叫 set_theme() 函數。
sns.set_theme()
sinplot()
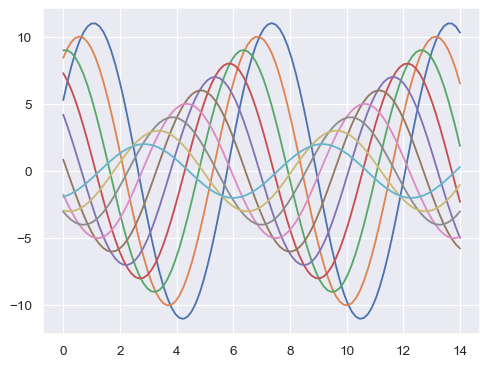
(請注意,在 0.8 之前的 seaborn 版本中,set_theme() 是在匯入時呼叫。在後續版本則必須明確呼叫它)。
Seaborn 將 matplotlib 參數分成兩個獨立組。第一組設定繪圖的美學樣式,第二組縮放圖形的各種元素,以便輕鬆套用於不同的情境。
下列兩組函數可處理這些參數的介面。為控制樣式,請使用 axes_style() 和 set_style() 函數。為縮放繪圖,請使用 plotting_context() 和 set_context() 函數。在這兩種情況下,第一個函數會傳回參數字典,第二個函數會設定 matplotlib 的預設值。
Seaborn 圖形樣式#
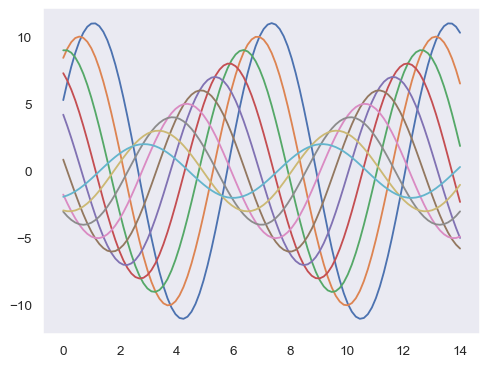
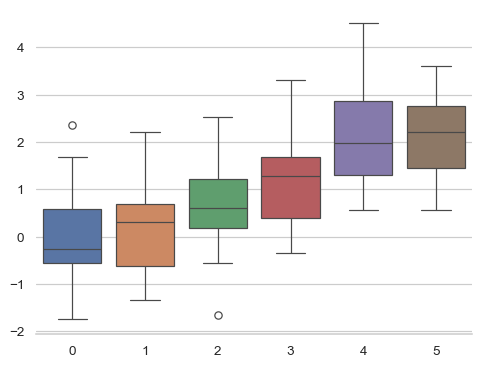
Seaborn 共有五種預設佈景主題:darkgrid、whitegrid、dark、white 和 ticks。每個主題都適合不同的應用程式和個人喜好。預設主題為 darkgrid。如同上方所述,格線有助於將繪圖當成定量資訊的查詢表,而灰白底色有助於避免格線與代表資料的線條競爭。主題 whitegrid 類似,但較適合有大量資料元素的繪圖。
sns.set_style("whitegrid")
data = np.random.normal(size=(20, 6)) + np.arange(6) / 2
sns.boxplot(data=data);

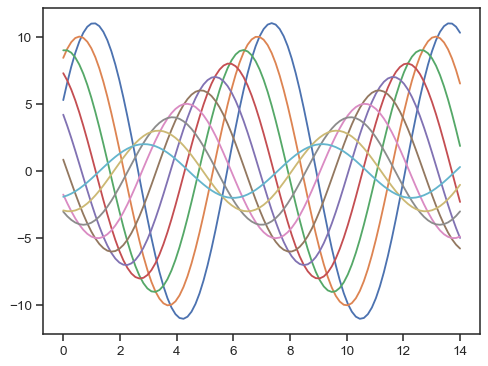
對於許多繪圖(尤其是像簡報這類想要使用圖表來提供資料模式印象的設定),格線較不必要。
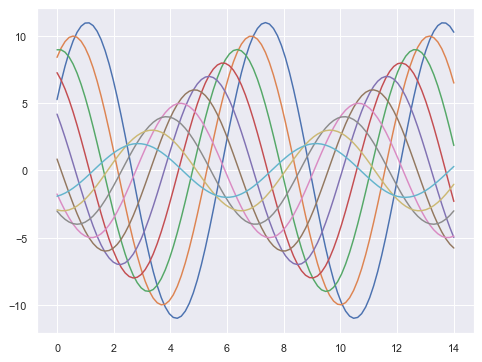
sns.set_style("dark")
sinplot()
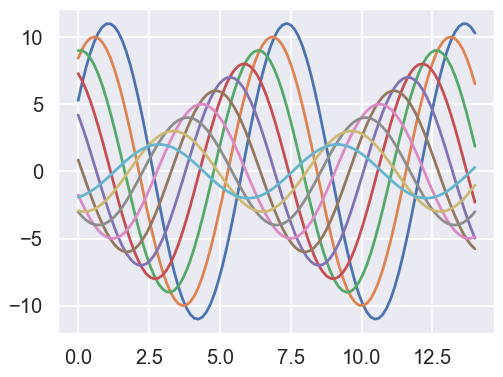
sns.set_style("white")
sinplot()

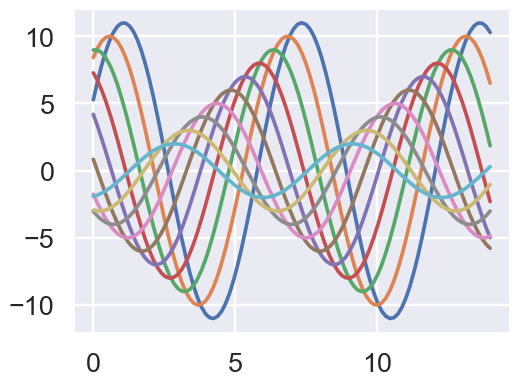
有時,您可能想要在繪圖中額外加入一些結構,這時就不妨使用刻度
sns.set_style("ticks")
sinplot()
移除座標軸線#
要移除不必要的上方及右側座標軸線,可以使用 white 和 ticks 樣式,還可呼叫 seaborn 函數 despine() 來移除它們
sinplot()
sns.despine()
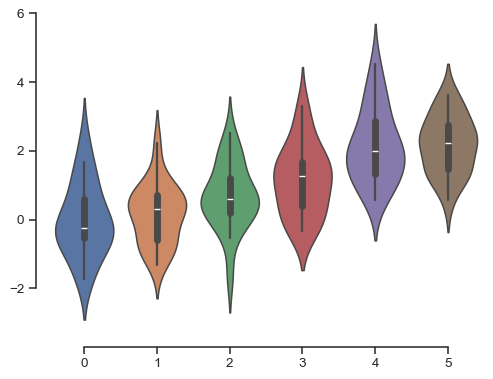
部分繪圖可從將軸線從資料中偏移受益,這可在呼叫 despine() 時執行。當刻度沒有涵蓋座標軸的整個範圍時,trim 參數會限制 оставшихся 軸線的範圍。
f, ax = plt.subplots()
sns.violinplot(data=data)
sns.despine(offset=10, trim=True);
您也可以使用 despine() 的其他引數來控制要移除哪些邊框
sns.set_style("whitegrid")
sns.boxplot(data=data, palette="deep")
sns.despine(left=True)
暫時設定圖形樣式#
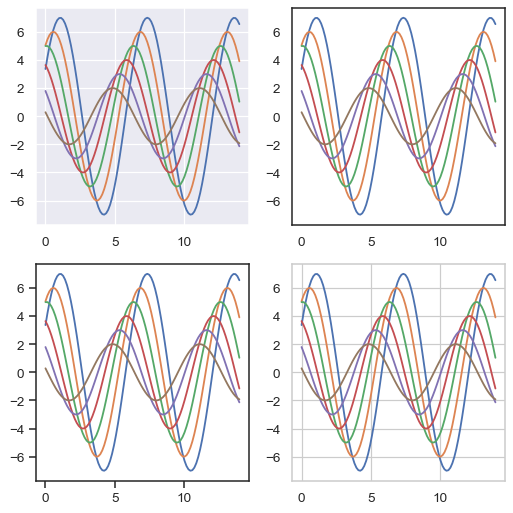
儘管很容易切換來切換去,您也可以在 with 陳述式中使用 axes_style() 函式暫時設定繪製參數。這也允許您製作不同樣式的圖形軸
f = plt.figure(figsize=(6, 6))
gs = f.add_gridspec(2, 2)

with sns.axes_style("darkgrid"):
    ax = f.add_subplot(gs[0, 0])
    sinplot(6)

with sns.axes_style("white"):
    ax = f.add_subplot(gs[0, 1])
    sinplot(6)

with sns.axes_style("ticks"):
    ax = f.add_subplot(gs[1, 0])
    sinplot(6)

with sns.axes_style("whitegrid"):
    ax = f.add_subplot(gs[1, 1])
    sinplot(6)

f.tight_layout()
覆寫 seaborn 樣式的元素#
如果您想自訂 seaborn 樣式,您可以傳遞一個參數字典給 rc 引數,其中 axes_style() 和 set_style()。請注意,透過這個方法,您只能覆寫樣式定義中所包含的參數。(但是,較高層級的 set_theme() 函式會採用任何 matplotlib 參數的字典)。
如果您想看看包含哪些參數,您可以直接呼叫函式而不使用任何引數,其會傳回目前的設定
sns.axes_style()
然後,您可以設定這些參數的不同版本
sns.set_style("darkgrid", {"axes.facecolor": ".9"})
sinplot()
調整繪製元素大小#
另一組參數控制繪製元素的比例,其讓您使用相同的程式碼建立適於在適合較大或較小繪製環境中使用的繪製。
首先,讓我們透過呼叫 set_theme() 來重設預設參數
sns.set_theme()
四種預設情境會按照相對大小排列,分別是 paper、notebook、talk 和 poster。其中 notebook 樣式為預設值,並用於以上的繪製。
sns.set_context("paper")
sinplot()
sns.set_context("talk")
sinplot()
sns.set_context("poster")
sinplot()
您現在對樣式函數所知的大部分知識都應該也能轉移到情境函式。
您可以使用這些名稱之一呼叫 set_context() 來設定參數,而且您可以透過提供參數值的字典來覆寫參數。
您還可以在變更背景時獨立縮放字型元素的大小。(此選項也可以透過最上層 set() 函式提供)。
sns.set_context("notebook", font_scale=1.5, rc={"lines.linewidth": 2.5})
sinplot()
同樣地,您可以在 with 敘述下方暫時控制嵌套圖形大小。
樣式和背景都可以透過 set() 函式快速設定。此函式也會設定預設色彩盤,但稍後的教學課程會更詳細地介紹這一點〈下一節〉。