seaborn.move_legend#
- seaborn.move_legend(obj, loc, **kwargs)#
在新的位置重新建立圖表的圖例。
此名稱稍微用詞不當。Matplotlib 圖例不會公開對其位置參數的控制。因此,此函數會建立新的圖例,從原始物件複製資料,然後將原始物件移除。
- 參數:
- obj具有圖表的物件
此引數可以是 seaborn 或 matplotlib 物件
- locstr 或 int
位置引數,如
matplotlib.axes.Axes.legend()。- kwargs
其他關鍵字引數會傳遞至
matplotlib.axes.Axes.legend()。
範例
對於軸層級函數,請傳遞
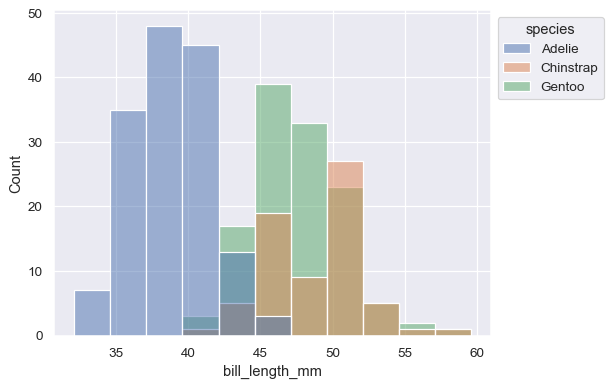
matplotlib.axes.Axes物件並提供新的位置。ax = sns.histplot(penguins, x="bill_length_mm", hue="species") sns.move_legend(ax, "center right")
使用
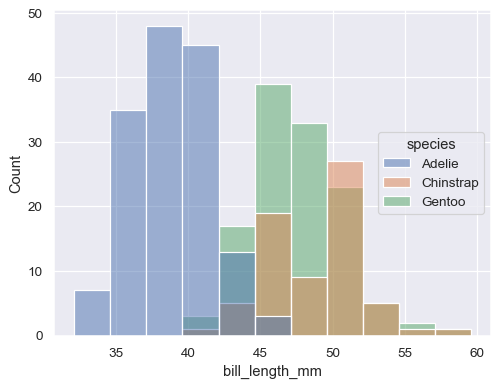
bbox_to_anchor參數進行更精細的控制,包括將圖例移到軸外ax = sns.histplot(penguins, x="bill_length_mm", hue="species") sns.move_legend(ax, "upper left", bbox_to_anchor=(1, 1))
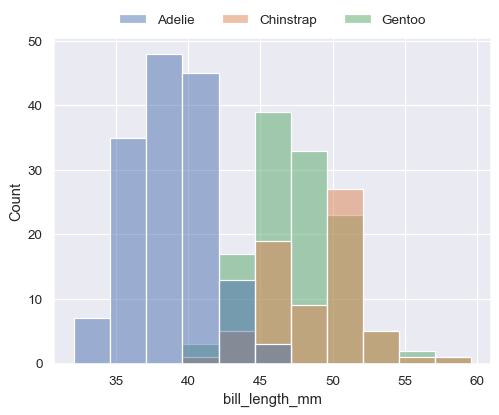
傳遞其他
matplotlib.axes.Axes.legend()參數以更新其他屬性ax = sns.histplot(penguins, x="bill_length_mm", hue="species") sns.move_legend( ax, "lower center", bbox_to_anchor=(.5, 1), ncol=3, title=None, frameon=False, )
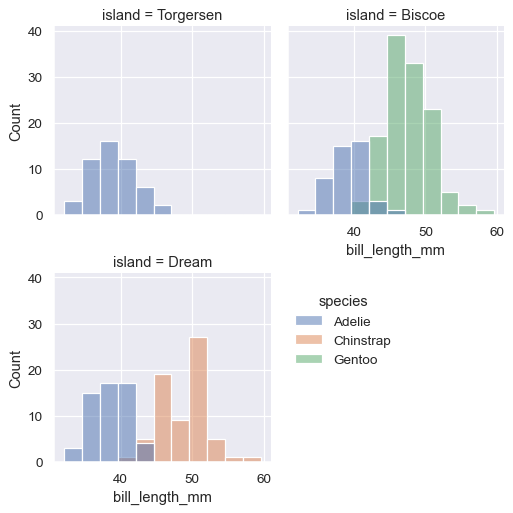
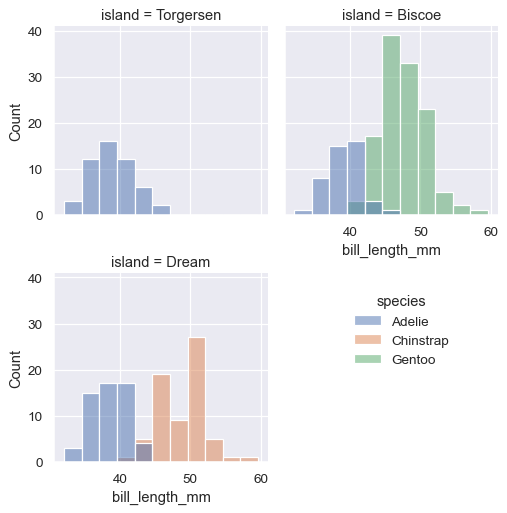
也可以移動圖層級函數建立的圖例。但在微調位置時,您必須記住,圖形右側會有額外的空白空間
g = sns.displot(
    penguins,
    x="bill_length_mm", hue="species",
    col="island", col_wrap=2, height=3,
)
sns.move_legend(g, "upper left", bbox_to_anchor=(.55, .45))
避免這種情況的一種方法是在
FacetGrid上設定legend_out=Falseg = sns.displot( penguins, x="bill_length_mm", hue="species", col="island", col_wrap=2, height=3, facet_kws=dict(legend_out=False), ) sns.move_legend(g, "upper left", bbox_to_anchor=(.55, .45), frameon=False)