seaborn.objects.Text#
- class seaborn.objects.Text(artist_kws=<factory>, text=<''>, color=<'k'>, alpha=<1>, fontsize=<rc:font.size>, halign=<'center'>, valign=<'center_baseline'>, offset=<4>)#
用來註解或表示資料值的文字標記。
範例
在圖表上的 x/y 位置新增文字
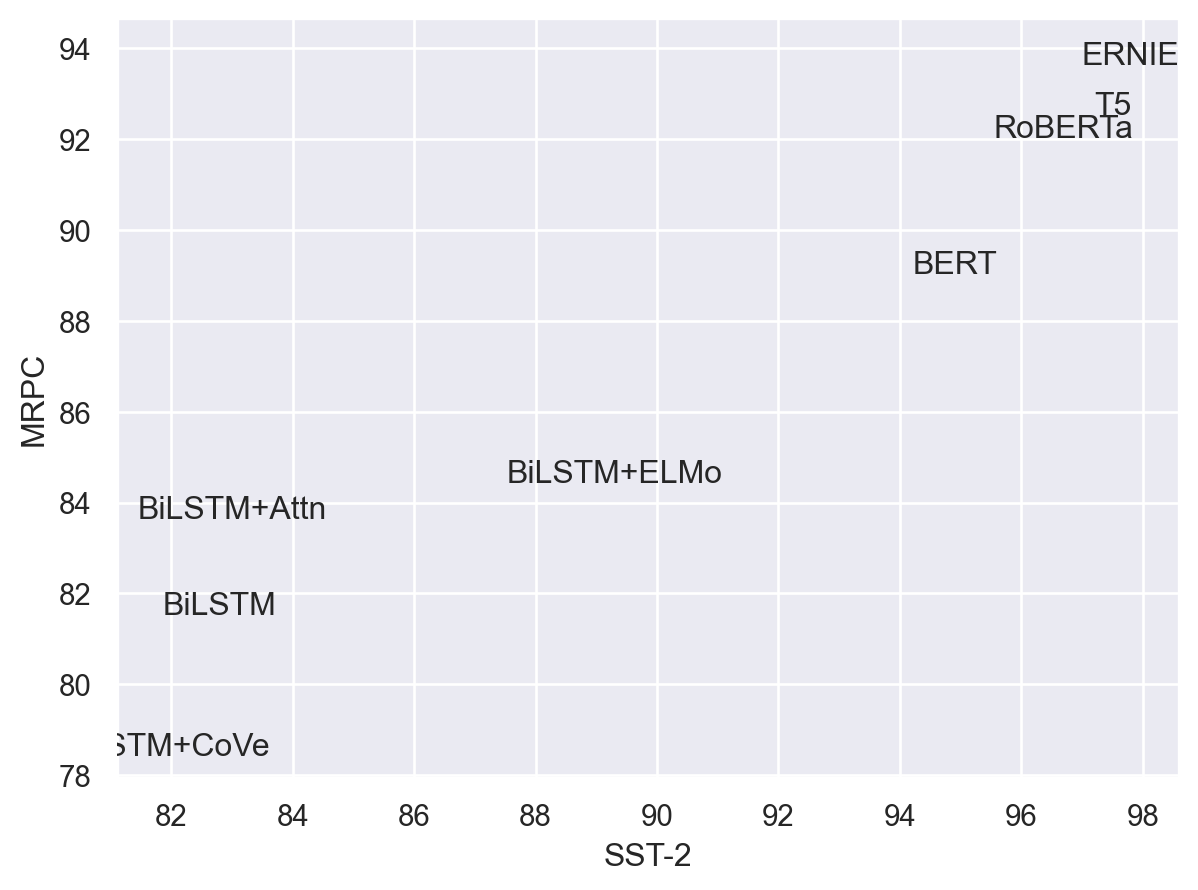
(
    so.Plot(glue, x="SST-2", y="MRPC", text="Model")
    .add(so.Text())
)
新增長條圖註解,並使用
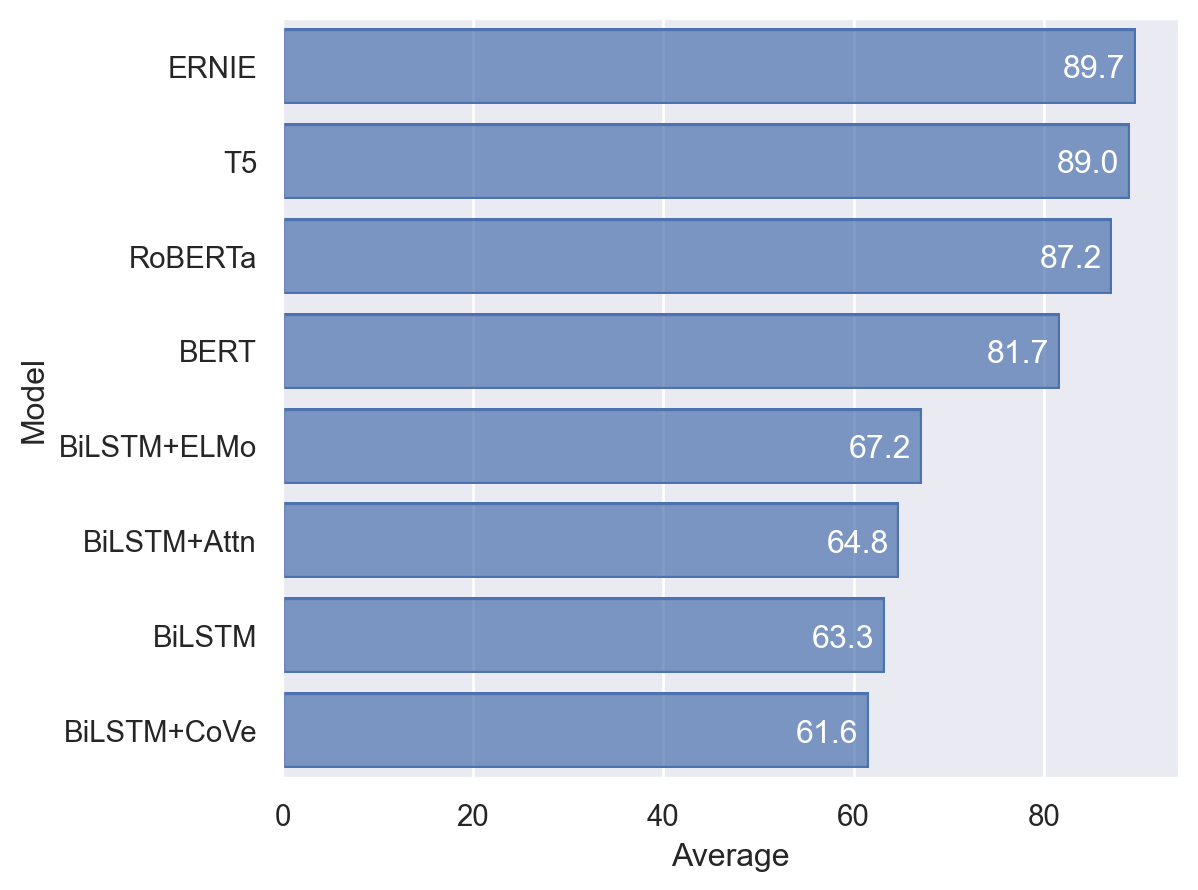
halign水平對齊( so.Plot(glue, x="Average", y="Model", text="Average") .add(so.Bar()) .add(so.Text(color="w", halign="right")) )
使用
offset微調對齊方式( so.Plot(glue, x="Average", y="Model", text="Average") .add(so.Bar()) .add(so.Text(color="w", halign="right", offset=6)) )

在點上方新增文字,並使用第三個變數對應文字顏色
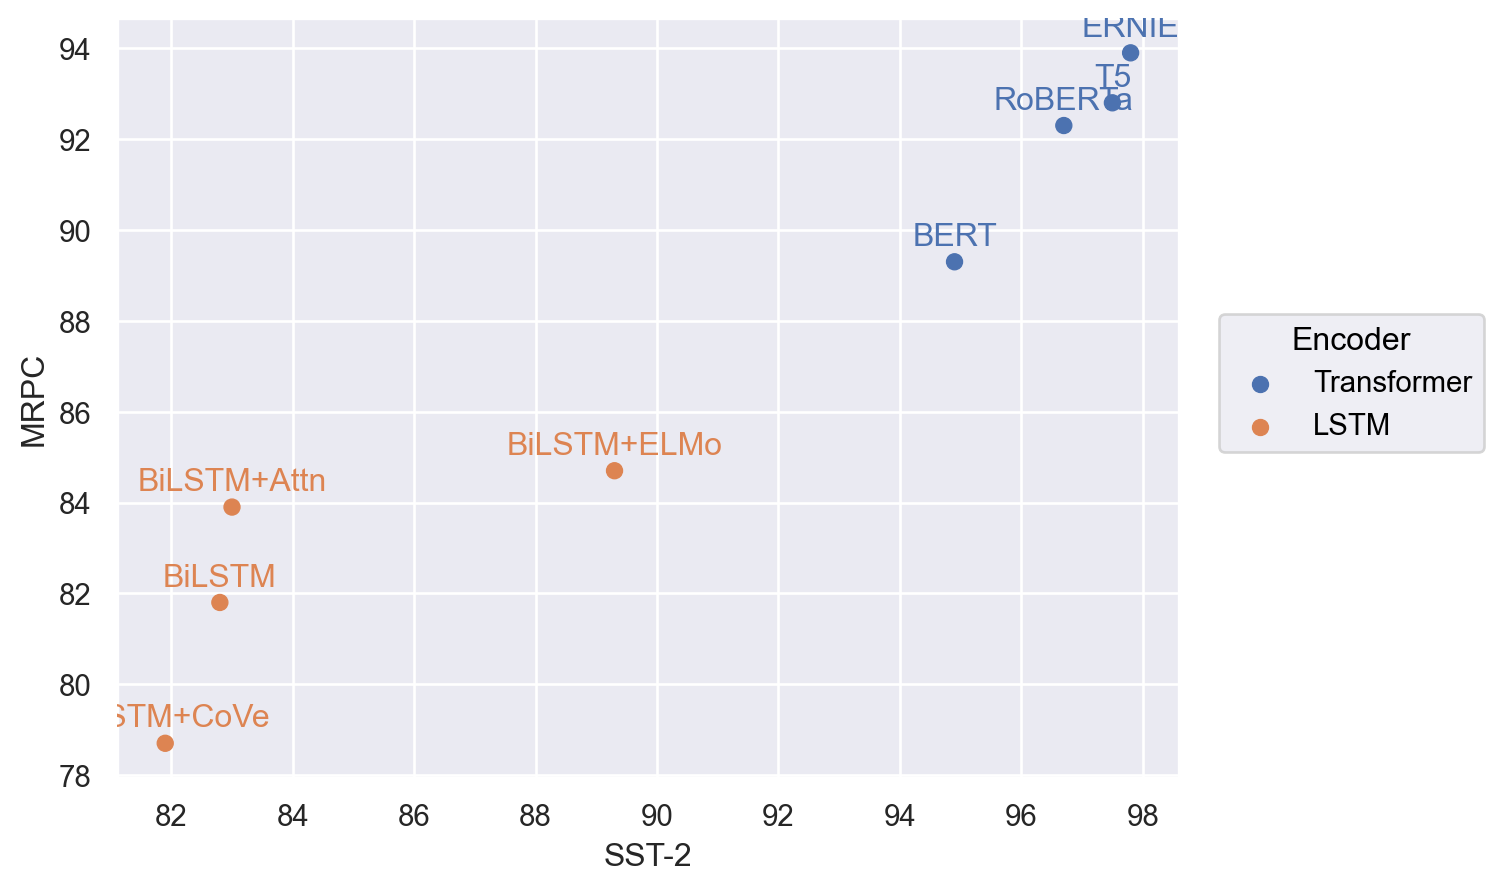
(
    so.Plot(glue, x="SST-2", y="MRPC", color="Encoder", text="Model")
    .add(so.Dot())
    .add(so.Text(valign="bottom"))

)
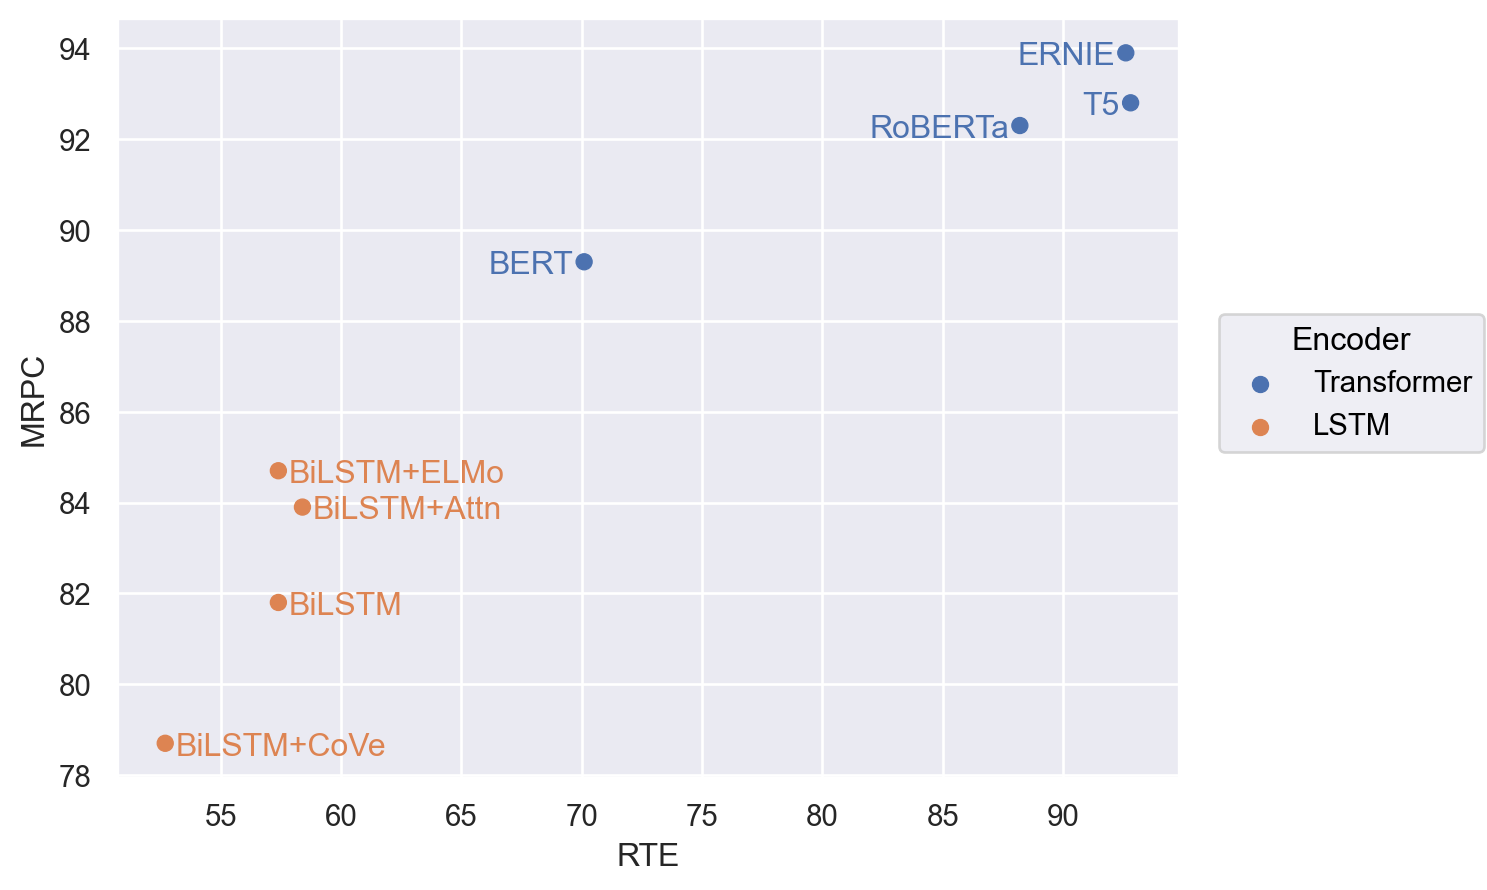
對應文字對齊方式以更好地利用空間
(
    so.Plot(glue, x="RTE", y="MRPC", color="Encoder", text="Model")
    .add(so.Dot())
    .add(so.Text(), halign="Encoder")
    .scale(halign={"LSTM": "left", "Transformer": "right"})
)
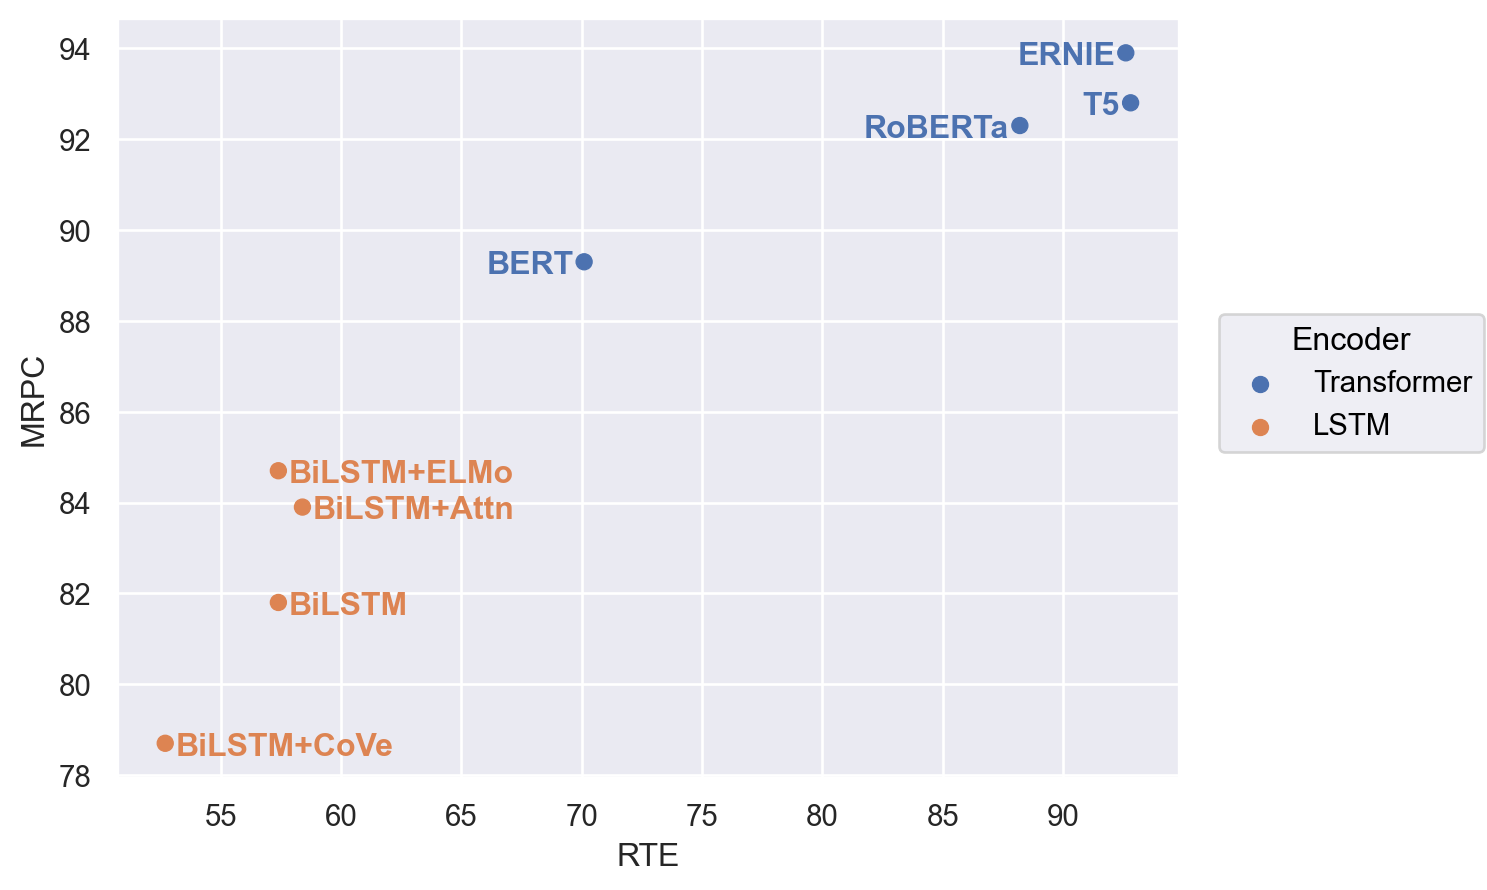
使用額外的 matplotlib 參數來控制文字的外觀
(
    so.Plot(glue, x="RTE", y="MRPC", color="Encoder", text="Model")
    .add(so.Dot())
    .add(so.Text({"fontweight": "bold"}), halign="Encoder")
    .scale(halign={"LSTM": "left", "Transformer": "right"})
)