seaborn.objects.Plot.on#
- Plot.on(target)#
提供現有的 Matplotlib 圖形或軸以繪製圖表。
當使用此方法時,您還需要明確呼叫一個觸發編譯的方法,例如
Plot.show()或Plot.save()。如果您想使用 matplotlib 進行後處理,您需要先呼叫Plot.plot()以編譯圖表,而無需渲染它。- 參數:
- targetAxes、SubFigure 或 Figure
要使用的 Matplotlib 物件。傳遞
matplotlib.axes.Axes將新增藝術家,而不會以其他方式修改圖形。否則,將在給定的matplotlib.figure.Figure或matplotlib.figure.SubFigure的空間內建立子圖。
範例
傳遞
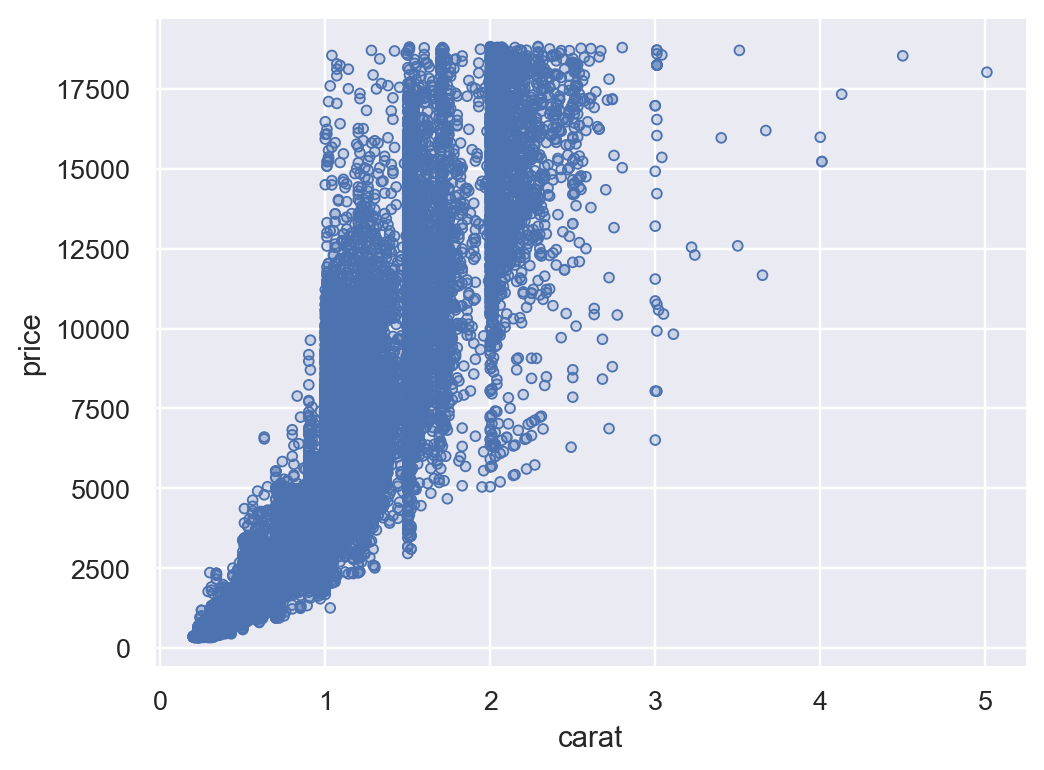
matplotlib.axes.Axes物件提供最接近 seaborn 軸級繪圖功能的功能。請注意,產生的圖像與使用Plot建立的其他圖像不同。這是因為繪圖主題使用建立軸時的全局 rcParams,而不是Plot預設值p = so.Plot(diamonds, "carat", "price").add(so.Dots()) f, ax = plt.subplots() p.on(ax).show()

或者,呼叫
matplotlib.pyplot.figure()將延遲軸的建立到Plot,它將套用預設主題(以及使用Plot.theme()指定的任何自訂設定)f = plt.figure() p.on(f).show()
建立
matplotlib.figure.Figure物件將完全繞過pyplot。這對於在 GUI 應用程式中嵌入Plot圖形可能很有用f = mpl.figure.Figure() p.on(f).plot()

使用
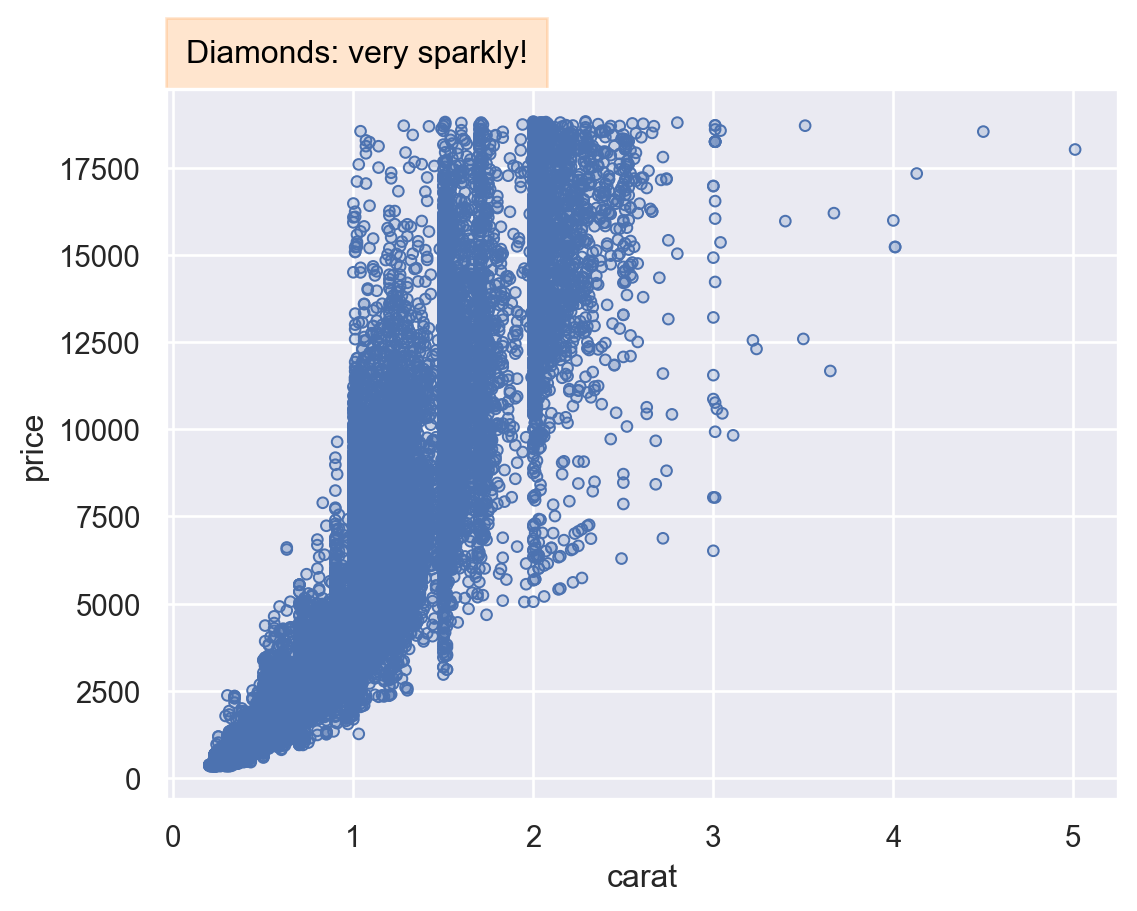
Plot.on還可以存取底層 matplotlib 物件,這對於深度自訂可能很有用。但是它需要仔細注意Plot被指定、編譯、自訂和顯示的操作順序f = mpl.figure.Figure() res = p.on(f).plot() ax = f.axes[0] rect = mpl.patches.Rectangle( xy=(0, 1), width=.4, height=.1, color="C1", alpha=.2, transform=ax.transAxes, clip_on=False, ) ax.add_artist(rect) ax.text( x=rect.get_width() / 2, y=1 + rect.get_height() / 2, s="Diamonds: very sparkly!", size=12, ha="center", va="center", transform=ax.transAxes, ) res
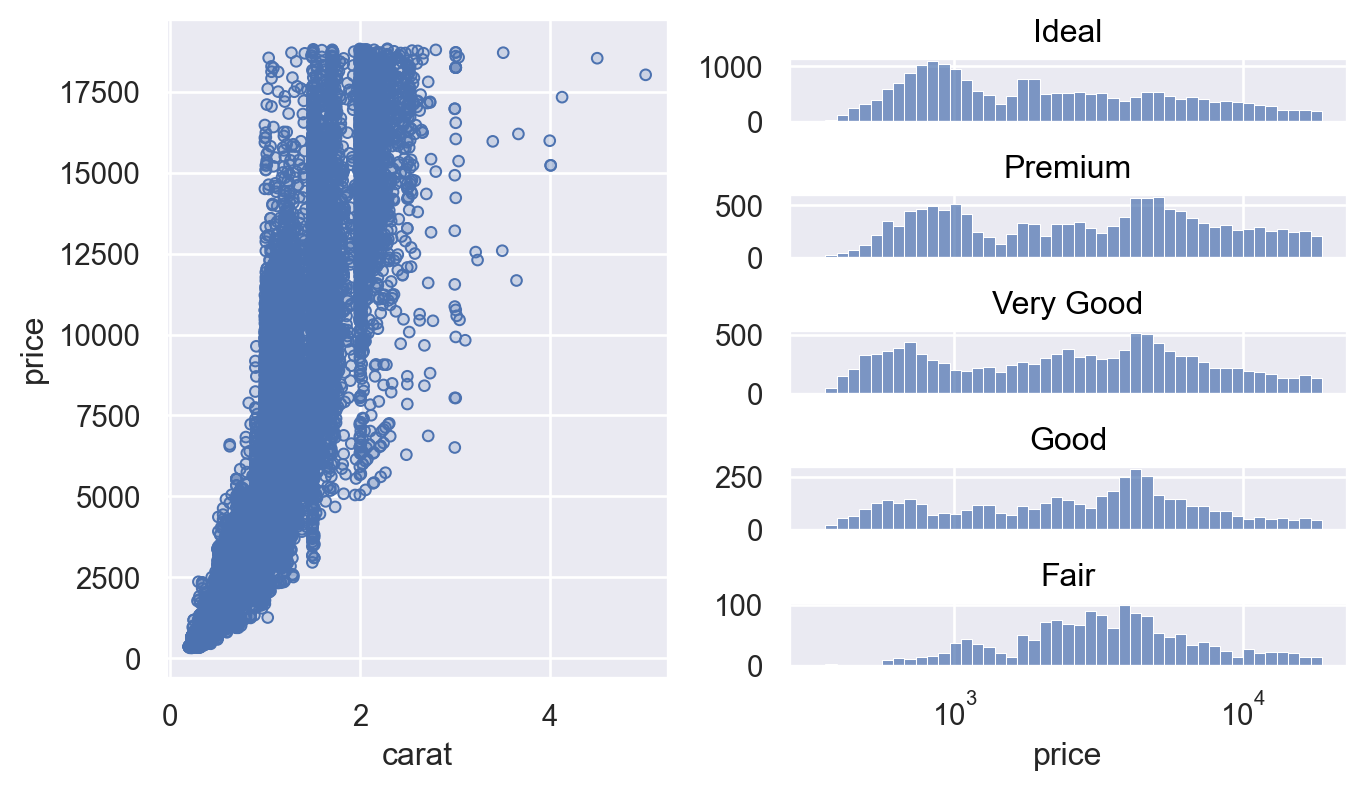
Matplotlib 3.4 引入了
matplotlib.figure.Figure.subfigures()的概念,這使得組合多個子圖排列更加容易。這些也可以傳遞給Plot.on(),f = mpl.figure.Figure(figsize=(7, 4), dpi=100, layout="constrained") sf1, sf2 = f.subfigures(1, 2) p.on(sf1).plot() ( so.Plot(diamonds, x="price") .add(so.Bars(), so.Hist()) .facet(row="cut") .scale(x="log") .share(y=False) .on(sf2) )