seaborn.rugplot#
- seaborn.rugplot(data=None, *, x=None, y=None, hue=None, height=0.025, expand_margins=True, palette=None, hue_order=None, hue_norm=None, legend=True, ax=None, **kwargs)#
藉由沿著 x 和 y 軸繪製刻度來繪製邊際分佈。
此函數旨在透過不引人注意的方式顯示個別觀察值的位置,以補充其他繪圖。
- 參數:
- data
pandas.DataFrame、numpy.ndarray、映射或序列 輸入資料結構。可以是可指派給具名變數的長格式向量集合,或是將在內部重新塑形的寬格式資料集。
- x, y
data中的向量或鍵 指定 x 和 y 軸位置的變數。
- hue
data中的向量或鍵 對應以決定繪圖元素顏色的語義變數。
- height浮點數
每個地毯元素覆蓋的軸範圍比例。可以是負數。
- expand_margins布林值
若為 True,則將軸邊距增加地毯的高度,以避免與其他元素重疊。
- palette字串、清單、字典或
matplotlib.colors.Colormap 選擇顏色以用於映射
hue語義的方法。字串值會傳遞至color_palette()。清單或字典值表示類別映射,而色圖物件表示數值映射。- hue_order字串向量
指定
hue語義的類別層級的處理和繪圖順序。- hue_norm元組或
matplotlib.colors.Normalize 一對值,可設定資料單位中的正規化範圍,或是一個物件,將從資料單位對應到 [0, 1] 間隔。使用表示數值映射。
- legend布林值
若為 False,則不會為語義變數新增圖例。
- ax
matplotlib.axes.Axes 用於繪圖的預先存在的軸。否則,請在內部呼叫
matplotlib.pyplot.gca()。- kwargs
其他關鍵字引數會傳遞至
matplotlib.collections.LineCollection()
- data
- 傳回:
matplotlib.axes.Axes包含繪圖的 matplotlib 軸。
範例
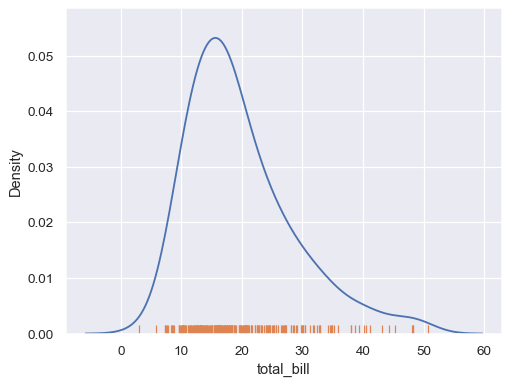
沿著其中一個軸新增地毯
import seaborn as sns; sns.set_theme()
tips = sns.load_dataset("tips")
sns.kdeplot(data=tips, x="total_bill")
sns.rugplot(data=tips, x="total_bill")
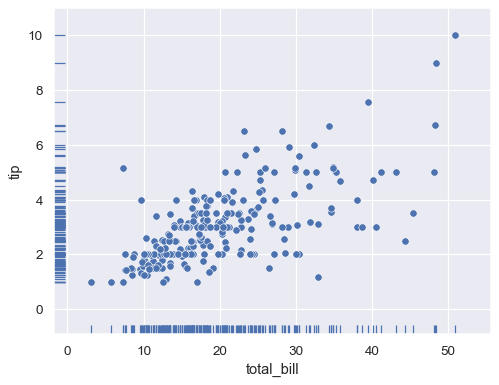
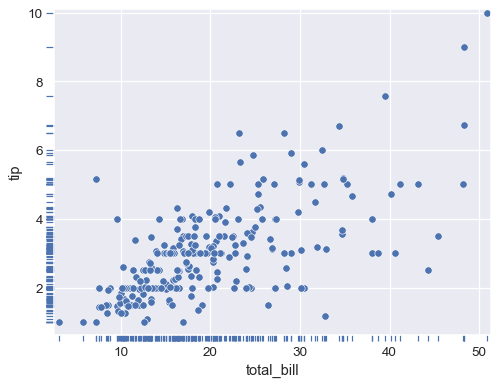
沿著兩個軸新增地毯
sns.scatterplot(data=tips, x="total_bill", y="tip")
sns.rugplot(data=tips, x="total_bill", y="tip")
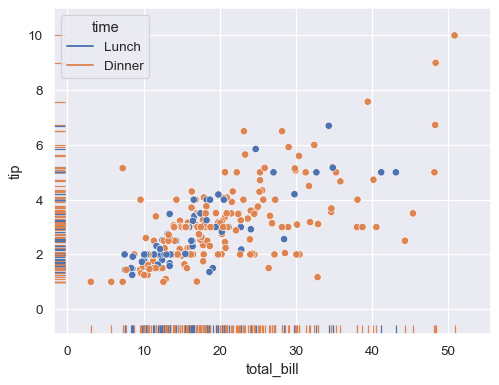
使用色調映射表示第三個變數
sns.scatterplot(data=tips, x="total_bill", y="tip", hue="time")
sns.rugplot(data=tips, x="total_bill", y="tip", hue="time")
繪製較高的地毯
sns.scatterplot(data=tips, x="total_bill", y="tip")
sns.rugplot(data=tips, x="total_bill", y="tip", height=.1)
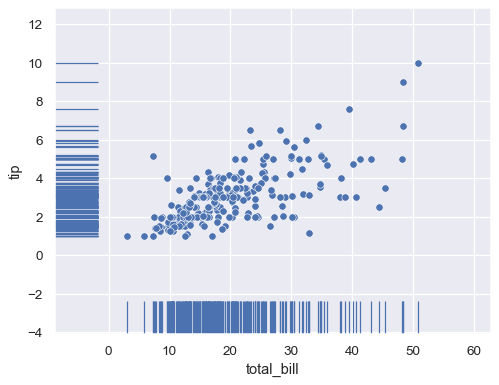
將地毯放在軸外
sns.scatterplot(data=tips, x="total_bill", y="tip")
sns.rugplot(data=tips, x="total_bill", y="tip", height=-.02, clip_on=False)
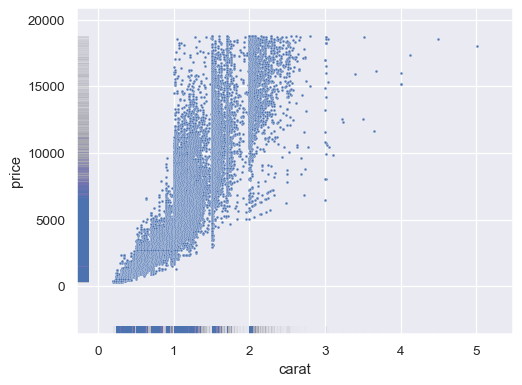
使用較細的線條和 alpha 混合顯示較大資料集的密度
diamonds = sns.load_dataset("diamonds")
sns.scatterplot(data=diamonds, x="carat", y="price", s=5)
sns.rugplot(data=diamonds, x="carat", y="price", lw=1, alpha=.005)